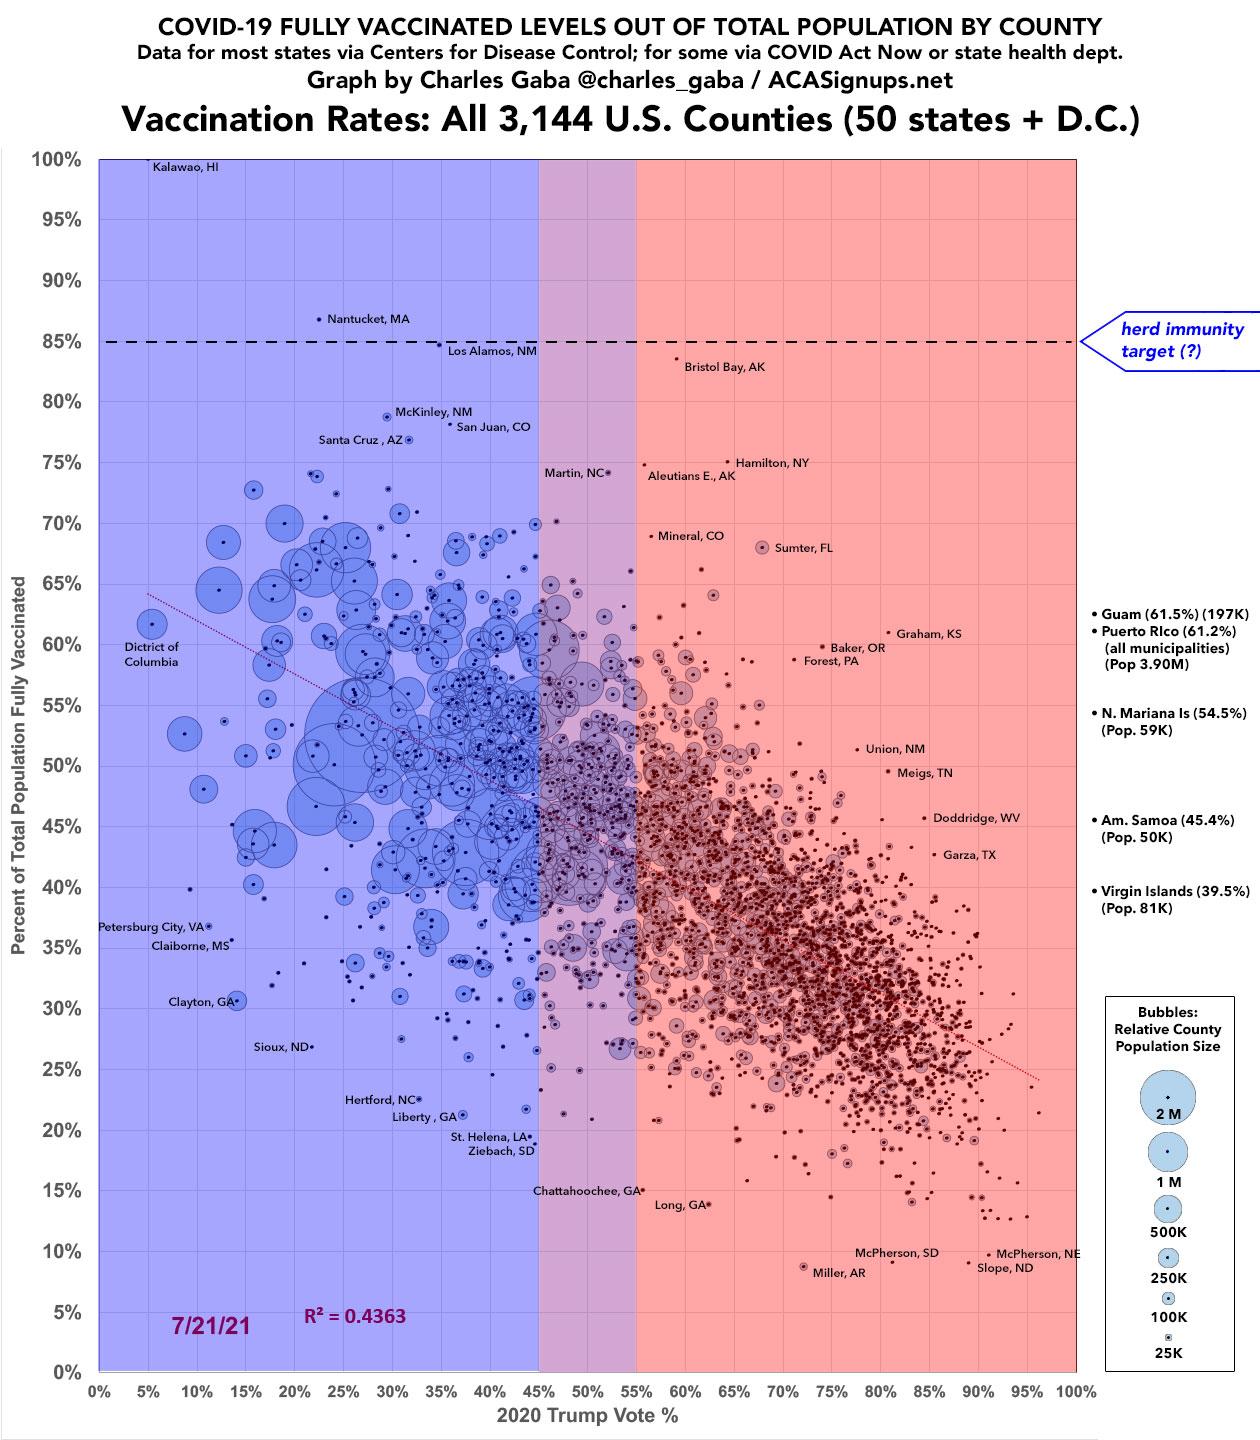
Kinda is, and pretty consistent across the board. The graph didn’t copy well but California has 60% of whites vaccinated but only 45% of blacks and 44% of Hispanics. Seems like a lot.
Figure 3
Percent of Total Population that has Received a COVID-19 Vaccine Dose by Race/Ethnicity, Selected States, July 19, 2021
White Black Hispanic Asian
Percent Vaccinated Percent Vaccinated White to Black Ratio Percentage Points from White Percent Vaccinated White to Hispanic Ratio Percentage Points from White Percent Vaccinated White to Asian Ratio Percentage Points from White
Total (40 States) 48% 36% 1.3 −12 41% 1.2 −7 65% 0.7 17
Alabama 33% 32% 1.0 −1 28% 1.2 −5 64% 0.5 31
Alaska 39% 45% 0.8 7 30% 1.3 −8 54% 0.7 16
Arizona 45% 31% 1.4 −13 25% 1.8 −19 58% 0.8 13
California 60% 45% 1.3 −15 44% 1.4 −16 70% 0.9 10
Colorado 59% 47% 1.3 −12 27% 2.2 −32 56% 1.1 −3
Connecticut 64% 44% 1.5 −21 51% 1.3 −13 69% 0.9 5
Delaware 52% 38% 1.4 −14 43% 1.2 −9 62% 0.8 10
District of Columbia 44% 33% 1.3 −11 46% 1.0 2 56% 0.8 12
Florida 51% 26% 2.0 −25 42% 1.2 −9 NR NR NR
Georgia 40% 34% 1.2 −6 33% 1.2 −7 73% 0.6 32
Idaho 29% 33% 0.9 4 22% 1.3 −7 48% 0.6 19
Indiana 45% 34% 1.3 −11 37% 1.2 −8 66% 0.7 21
Iowa 47% 23% 2.1 −24 29% 1.6 −17 48% 1.0 1
Kansas 39% 31% 1.2 −7 35% 1.1 −4 48% 0.8 9
Kentucky 41% 35% 1.2 −6 NR NR NR 54% 0.8 13
Louisiana 38% 37% 1.0 −0 40% 1.0 2 71% 0.5 33
Maryland 61% 51% 1.2 −10 54% 1.1 −8 73% 0.8 12
Massachusetts 68% 56% 1.2 −12 52% 1.3 −16 75% 0.9 7
Michigan 40% 29% 1.4 −11 34% 1.2 −6 47% 0.8 7
Minnesota 55% 42% 1.3 −13 42% 1.3 −13 62% 0.9 7
Mississippi 36% 36% 1.0 −0 31% 1.1 −4 72% 0.5 37
Missouri 39% 32% 1.2 −7 49% 0.8 9 59% 0.7 20
Nevada 38% 27% 1.4 −11 37% 1.0 −1 52% 0.7 14
New Mexico 65% 47% 1.4 −18 51% 1.3 −13 88% 0.7 24
New York 52% 37% 1.4 −15 48% 1.1 −4 80% 0.6 28
North Carolina 46% 39% 1.2 −7 39% 1.2 −7 71% 0.6 25
North Dakota 57% 36% 1.6 −21 42% 1.3 −15 51% 1.1 −6
Ohio 48% 35% 1.4 −12 41% 1.2 −7 72% 0.7 24
Oklahoma 35% 28% 1.3 −7 29% 1.2 −6 63% 0.5 28
Oregon 54% 71% 0.8 17 37% 1.5 −17 70% 0.8 16
Pennsylvania 44% 29% 1.5 −15 27% 1.6 −17 16% 2.7 −28
Rhode Island 61% 45% 1.3 −16 47% 1.3 −14 65% 0.9 4
South Carolina 36% 31% 1.2 −5 33% 1.1 −3 NR NR NR
South Dakota 45% 21% 2.2 −24 3% 13.7 −42 9% 5.1 −37
Tennessee 36% 31% 1.2 −5 39% 0.9 3 51% 0.7 15
Texas 44% 33% 1.3 −11 40% 1.1 −4 65% 0.7 21
Utah 46% 31% 1.5 −15 36% 1.3 −10 43% 1.1 −4
Vermont 71% 53% 1.3 −18 87% 0.8 16 76% 0.9 5
Virginia 53% 46% 1.1 −6 53% 1.0 0 77% 0.7 24
Washington 51% 48% 1.1 −3 40% 1.3 −11 73% 0.7 22
West Virginia 45% 42% 1.1 −2 NR NR NR NR NR NR
Wisconsin 50% 33% 1.5 −17 39% 1.3 −11 56% 0.9 6
NOTE: NR indicates data are not reported. *NM is excluded from the total across states due to non-comparable bridged race categories. **ND is excluded from the total across states because data on number of people vaccinated by R/E are not available. ***PA excludes data for Philadelphia due to differences in reporting. As of 6/21, PA total population data was updated to exclude Philadelphia; data should not be compared to earlier periods due to these data changes or corrections. As of 7/19, Pennsylvania has made changes or corrections to reported race/ethnicity data, resulting in a large decrease in overall vaccination counts. As of 6/30, Nebraska has permanently stopped updating its dashboard. Data may not be comparable across states due to differences in reporting periods and racial/ethnic classifications. States vary in whether they include or exclude Hispanic people from their racial groups and in their racial classifications. Total population data used to calculate rates is matched to each states’ racial classification approach. Rates may not match those reported on state websites due to differences in the source for total population data and/or ages included in the total population.
SOURCE: Vaccination data based on KFF analysis of publicly available data on state websites; total population data used to calculate rates based on KFF analysis of 2019 American Community Survey data. PNG